Last time we talked about commonly used UI components in iOS, I wonder if you can already create some simple UI interfaces?
However, it is difficult not to encounter bugs during practice, or the results may not directly meet expectations. At this point, we need to use the debugging feature!
Next, let's dive into the iOS series brought to you by "Xia Piao Piao" (4) — Xcode Debugging.

⚠️: The debugging techniques included in this section are not limited to iOS development; most IDEs should have these features.
Sweet: Breakpoint Related#
Adding Breakpoints#
Adding a breakpoint is simple; just click on the corresponding line number in the code. To delete a breakpoint, drag the breakpoint marker out of the area.
Conditional Breakpoints#
Right-click on the breakpoint - Edit Breakpoint, fill in the appropriate Condition, then when running to the breakpoint, it will only trigger the breakpoint and pause ⏸️ code execution if the Condition is met.

Automatically Execute Tasks at Breakpoints#
Right-click on the breakpoint - Edit Breakpoint, add Action, such as p cnt (debug command type), which means that when passing this breakpoint, it will print the cnt variable.
Check the Options below to continue running the code after executing the above Action without pausing.

Ignoring Breakpoints#
Right-click on the breakpoint - Edit Breakpoint, as shown in the red box, it will ignore the first trigger of the breakpoint and only pause on the second trigger, generally used to ignore initialization situations.

Exception Breakpoints#
You can add exception type breakpoints at the bottom left of the breakpoint navigation bar.
When an exception occurs, it will not cause a crash but will pause just before the crash, allowing you to clearly view the call stack (see the next section for details), locating the root cause of the crash.

Symbol Breakpoints#
You can add symbol type breakpoints at the bottom left of the breakpoint navigation bar, setting the Symbol to a method of a certain type, such as - [UIViewController viewDidLoad], which sets a generic breakpoint for that class method without needing to add breakpoints at each call.

PS: Refer to Xcode Advanced Debugging Techniques, Did You Know? — Jian Shu
Sour: Viewing Call Stack#
When entering a breakpoint, there are 3 ways to view the current call stack.
Breakpoint Navigation Bar#
The breakpoint navigation bar area displays all threads and the method call stack within each thread, with 0 representing the top method, i.e., the current method, and larger numbers calling smaller numbers.

PS: The methods 2 to 28 omitted in the above image are called from the iOS system's underlying layer. Since iOS is not open source, the underlying call stack cannot be seen.
Lower Toolbar#
The project name in the lower toolbar displays the same effect as the breakpoint navigation bar.

Debug Area#
The debug area can display the current call stack in text format by entering the command thread backtrace.

Additionally, you can view basic information about thread i using thread info [i].
PS: Refer to iOS Print Function Call Stack, View Where Variables Are Called — CSDN
Spicy: 3D View Hierarchy Inspection#
When using the app, click the red box button on the lower toolbar to view the current interface of the app (see the left side of the simulator in the image below) in a 3D view hierarchy (see the right side of the 3D image).

Through the lower toolbar, from left to right, we can: adjust the distance between view hierarchies | display clipped content, show constraints, change view modes, change backgrounds | select 2D/3D view | zoom | adjust the visible range of views.
![]()
Additionally, right-click on a layer, and the options shown in the image below will appear. Click Reveal in Debug Navigator to see the position of that layer among all layers, making it easier to clarify the nesting relationships between layers.

In summary, 3D view hierarchy inspection is very suitable for checking UI issues.
Well, the brief time is always so short. Was this issue very brief yet practical? Especially some advanced debugging techniques for breakpoints.
👏 Hope this helps you, feel free to leave comments for discussion!
See You Next Week#
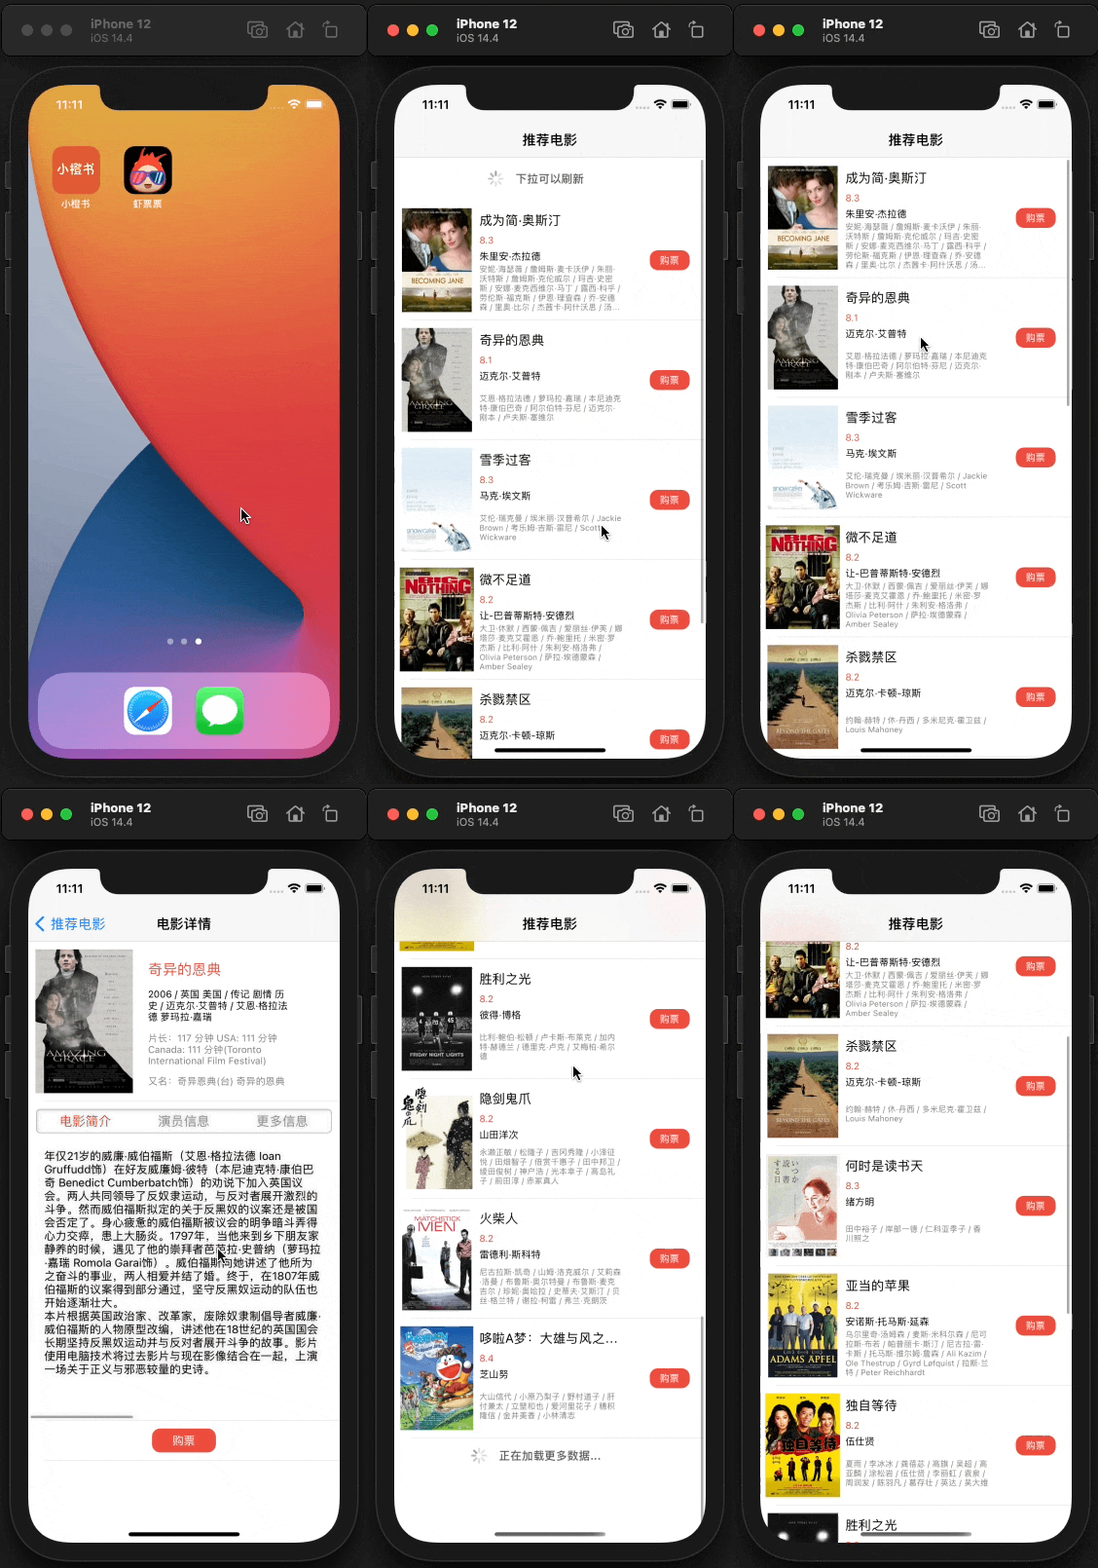
Let's take another look at the "Xia Piao Piao" App:

As you can see, in addition to the UI interface, it also includes these features: fetching network movie data, pull-to-refresh, load more on scroll, loading spinner interaction, etc. So are these features really difficult to implement? 👀
They may be difficult to implement, but that doesn't matter. There are many open-source third-party libraries online that have already implemented the above features; we just need to fetch and use them.
This is what we will talk about next week: CocoaPods — the dependency management tool for third-party libraries in iOS development.
🎺Stay tuned.
—— The temperature in Hunan dropped too quickly, heading back to Shenzhen to avoid the cold 🚄
2021.10.9